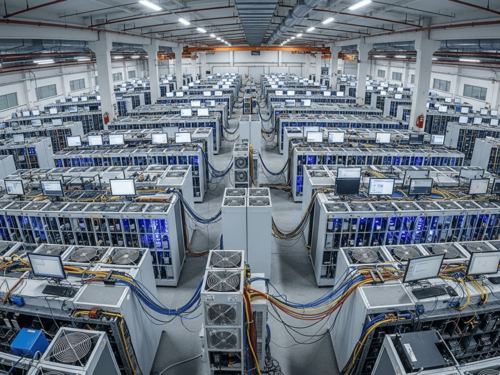
We focus on locations such as Mongolia where power price and uptime can be optimised, and reuse mining heat for greenhouses and local energy. The goal is to align profitability with real world impact.
Corporate and national level moves
Energy majors, financial institutions and policy driven players are moving into mining and digital currency infrastructure.
From buying assets to producing assets
Bitcoin is shifting from a market where people mainly buy coins to one where value is produced via infrastructure. It is closer to building an app platform than simply downloading an app.
Examples in Japan and overseas
Heat reuse projects in Hokkaido, megabank initiatives around digital yen, and Mongolia with power cost at roughly one third of Japan and a cold climate suitable for mining.
Three layer business model
Mining, agricultural heat reuse and local infrastructure form a three layer structure. The aim is industrial mining, not short term speculation.
Why timing matters
This is an industry where capex, power and finance scale together. Missing the timing makes it very hard to catch up once large scale infrastructure is in place.
Project and operator
ThermoMine Labs, operated by K FORCE FACTORY Inc.
Registered office
K FORCE FACTORY Inc., 33 Toyofuta, Room 301, Chiba, Japan
Representative
Kazuo Kobayashi
Concept
Real world mining business built on three layers: mining, heat to agriculture, and local infrastructure.
Planned hubs
Mongolia for mining and heat reuse, and Japan for planning, funding and technology collaboration.
Target partners
Individual and institutional investors, municipalities, energy companies, agricultural and aquaculture operators.
Planned activities
This is a draft description and will be updated as corporate structure and local entities are finalised.
This project does not sell mining machines themselves and does not accept deposits. Instead, it provides access to the hash power produced by machines in operation, based on a utilisation right contract.
Distribution of mining results is calculated in proportion to each participants utilisation share. Rewards are variable and depend on BTC price, network difficulty, power price and uptime and are not guaranteed.
The structure is a performance linked utilization right model built on actual mining operations. It is different from fixed yield products or profit guarantee schemes.
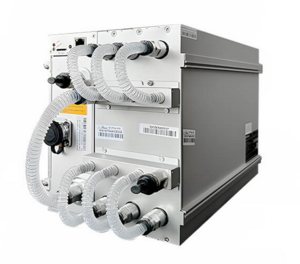
In the initial phase we plan to leverage the power environment in Mongolia and deploy approximately 500 units of Antminer S21 and S23 Hyd class machines.
The work includes development of a liquid cooling ready mining facility, high voltage intake and distribution, cooling systems, grid connection, and preparation of the selected factory site.
The estimated capital expenditure for this phase is in the range of JPY 800 to 1,000 million, subject to procurement terms and agreements with local power providers and facility operators.
In the mid term we plan to scale to around 1,000 units in total, building on Phase 1.
The goal is to improve operational efficiency and stabilise long term returns, establishing a more resilient performance based distribution model.
This phase involves expansion of liquid cooling capacity, upgrades to high voltage power equipment, additional cooling and heat exchange capacity, extra factory space and procurement of additional S21 and S23 Hyd class units.
The estimated capital expenditure for this phase is in the range of JPY 1.5 to 2.0 billion, with stepwise deployment based on agreements with local utilities and site operators.
Plans for later phases, including multi megawatt deployment and full integration with greenhouse projects, will be disclosed in line with progress on power contracts and local partnerships.
Selected examples from major corporates and the public sector that indicate tailwinds in this field.
Agile Energy X and related projects exploring BTC mining with surplus renewable power.
A model in Hokkaido where natural gas generation, mining and heat reuse are combined with fish farming.
Plans by the three megabanks to issue yen based stablecoins as part of digital currency strategies.
Japanese firms build mining capacity in the United States to serve institutional demand.
Select model, number of units, location and marketplace. The tool estimates mining profit and net ROI after 4 percent funding cost and 10 percent O and M, assuming 95 percent uptime and 2 percent pool fee. All numbers are indicative only.
| Model | Hash rate | Power draw |
|---|---|---|
| Antminer S21 XP Hyd | 473 TH per s | 5,676 W |
| Antminer S23 Hyd | 580 TH per s | 5,510 W |
Industrial power in Mongolia is around 12 to 13 JPY per kWh, which is roughly one third to one quarter of typical power prices in Japan.
The cold climate also reduces cooling cost, making it suitable for long term stable mining returns.
ROI animation and yearly model
This clip can be replaced by mp4, webm or Lottie animation as needed.
On the left select model, number of units, location, marketplace and BTC price, then press Simulate. This panel will show machine setup, mined BTC, revenue and a net ROI after deducting 4 percent funding cost and 10 percent operations and maintenance, assuming 95 percent uptime and 2 percent pool fee.
All numbers are rough simulations only and do not guarantee future returns.
Mining results are affected by BTC price, network difficulty, power tariffs and uptime. For this reason the project does not offer fixed yields. It is a performance linked model where distributions move with market conditions.
Conservative scenario: annual net return in the range of 4 to 6 percent
Base scenario: annual net return in the range of 8 to 15 percent
Bullish scenario: annual net return in the range of 15 to 20 percent
These ranges are indicative only and based on multiple assumptions. They do not represent promised yields or guaranteed distributions. BTC price, difficulty and power prices can move in both directions.
The project uses a performance linked distribution structure tied to BTC mining results. It is not a fixed yield scheme.
When BTC price rises, the fiat value of mined BTC increases even if the number of coins stays the same. As a result, the value of distributions mapped to utilisation share also tends to move higher, subject to changes in difficulty and operating conditions.
At the same time, a rise in difficulty or hash competition can reduce the number of coins mined. This means that higher BTC price does not automatically translate to a one to one increase in yield. Actual performance depends on several moving factors.
This section is intended to explain the structure at a conceptual level. It does not guarantee any specific future return. More detailed scenario tables by BTC price level will be published after final simulations.
For investment, joint ventures, equipment deployment, agricultural collaboration or media coverage, please feel free to reach out using the form below.